
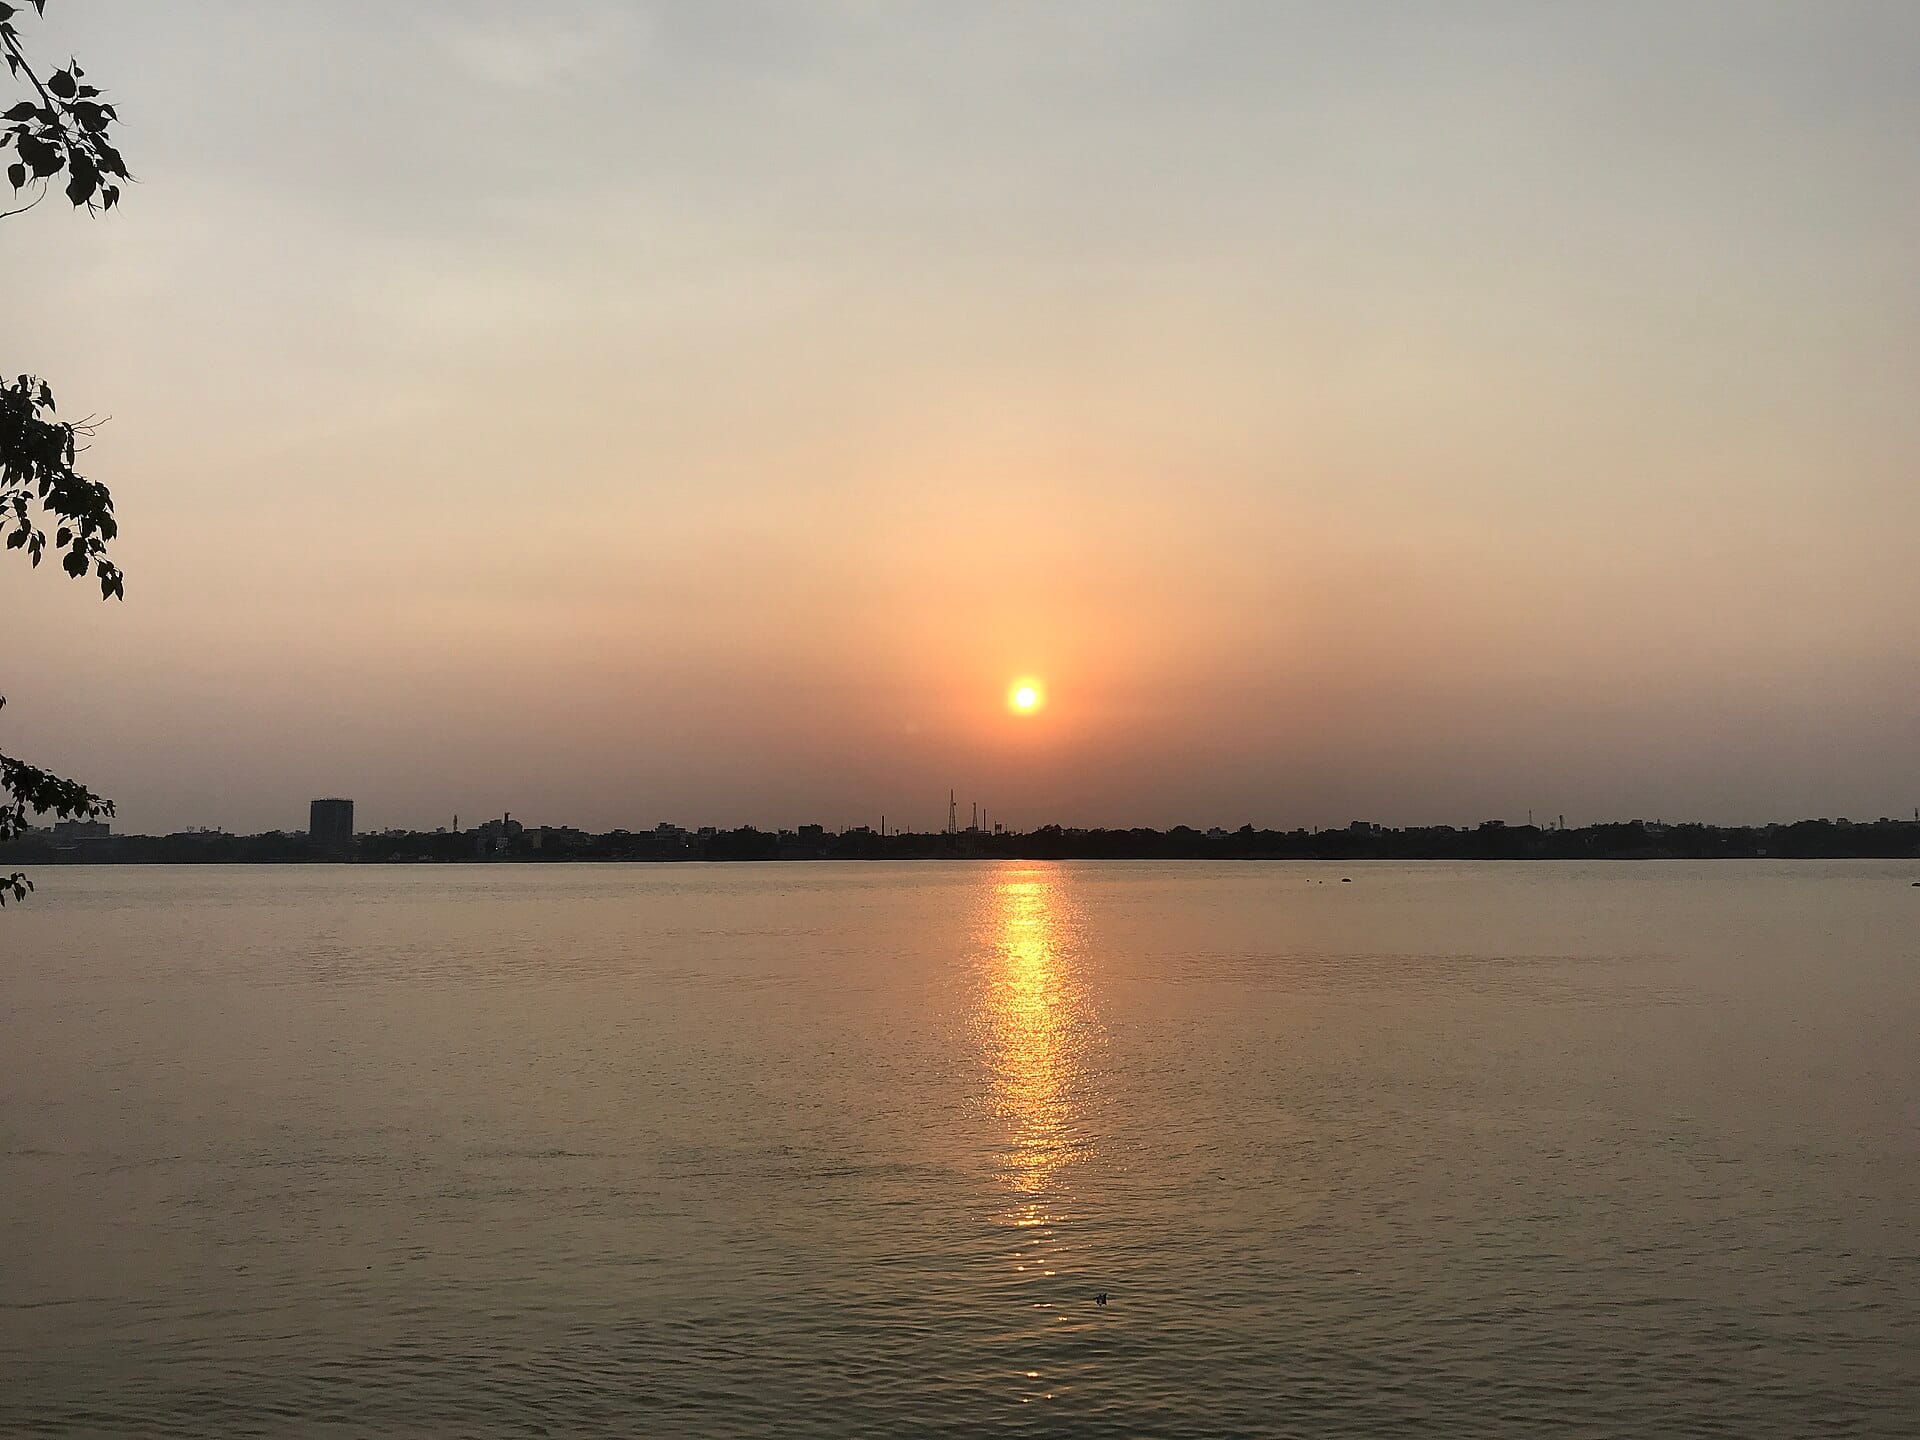
Rivers are cleaned at the factory gate as much as at the ghat. A new Ministry of Jal Shakti explainer on 13 October lays out how the Namami Gange industrial pollution effort has tried to shift regulation from occasional enforcement to continuous compliance, and the numbers suggest it has moved the needle.
The headline results
Across the Grossly Polluting Industries (GPIs) assessed since annual inspections began in 2017:
- Compliance rose from 39% in 2017 to 70% in 2025.
- In the Ganga basin alone, compliance reached 86% in 2025, and BOD load fell from 26 to 7.16 tonnes per day (a 72.46% reduction). Effluent discharge dropped from 349 to 274.88 million litres a day.
- Of 3,145 operational GPIs, 2,715 complied; 448 (about 14%) did not and face show-cause notices or closure action by state pollution control boards.
How the inspections work
The 2025 cycle assessed 3,703 GPIs (1,296 in the Ganga basin and 2,407 in the Yamuna basin) across 113 districts, covering potential discharge into 46 tributaries. Inspections are done by technical institutes with a state pollution board officer, sampling effluent at treatment-plant inlets and outlets and testing for pH, BOD, COD, TSS and TDS. Teams check real-time monitoring (OCEMS) connectivity, look for bypasses, and upload geo-tagged photo or video evidence to a portal. Twenty-five institutes took part in 2025; 40 are nominated for 2026.
Prevention, not just treatment
Sector charters now exist for pulp and paper, sugar, distilleries, textiles and tanneries, sectors that accounted for roughly 70% of GPIs and 88% of pollution load in the earlier assessment. They set targets for cutting water use, upgrading effluent plants and recycling water. A 2022 push on 246 top-polluting units saw 222 submit action plans; pollution load among them fell an estimated 65% in 2022-23, from 18.68 to 6.381 tonnes per day.
The shared-plant gap
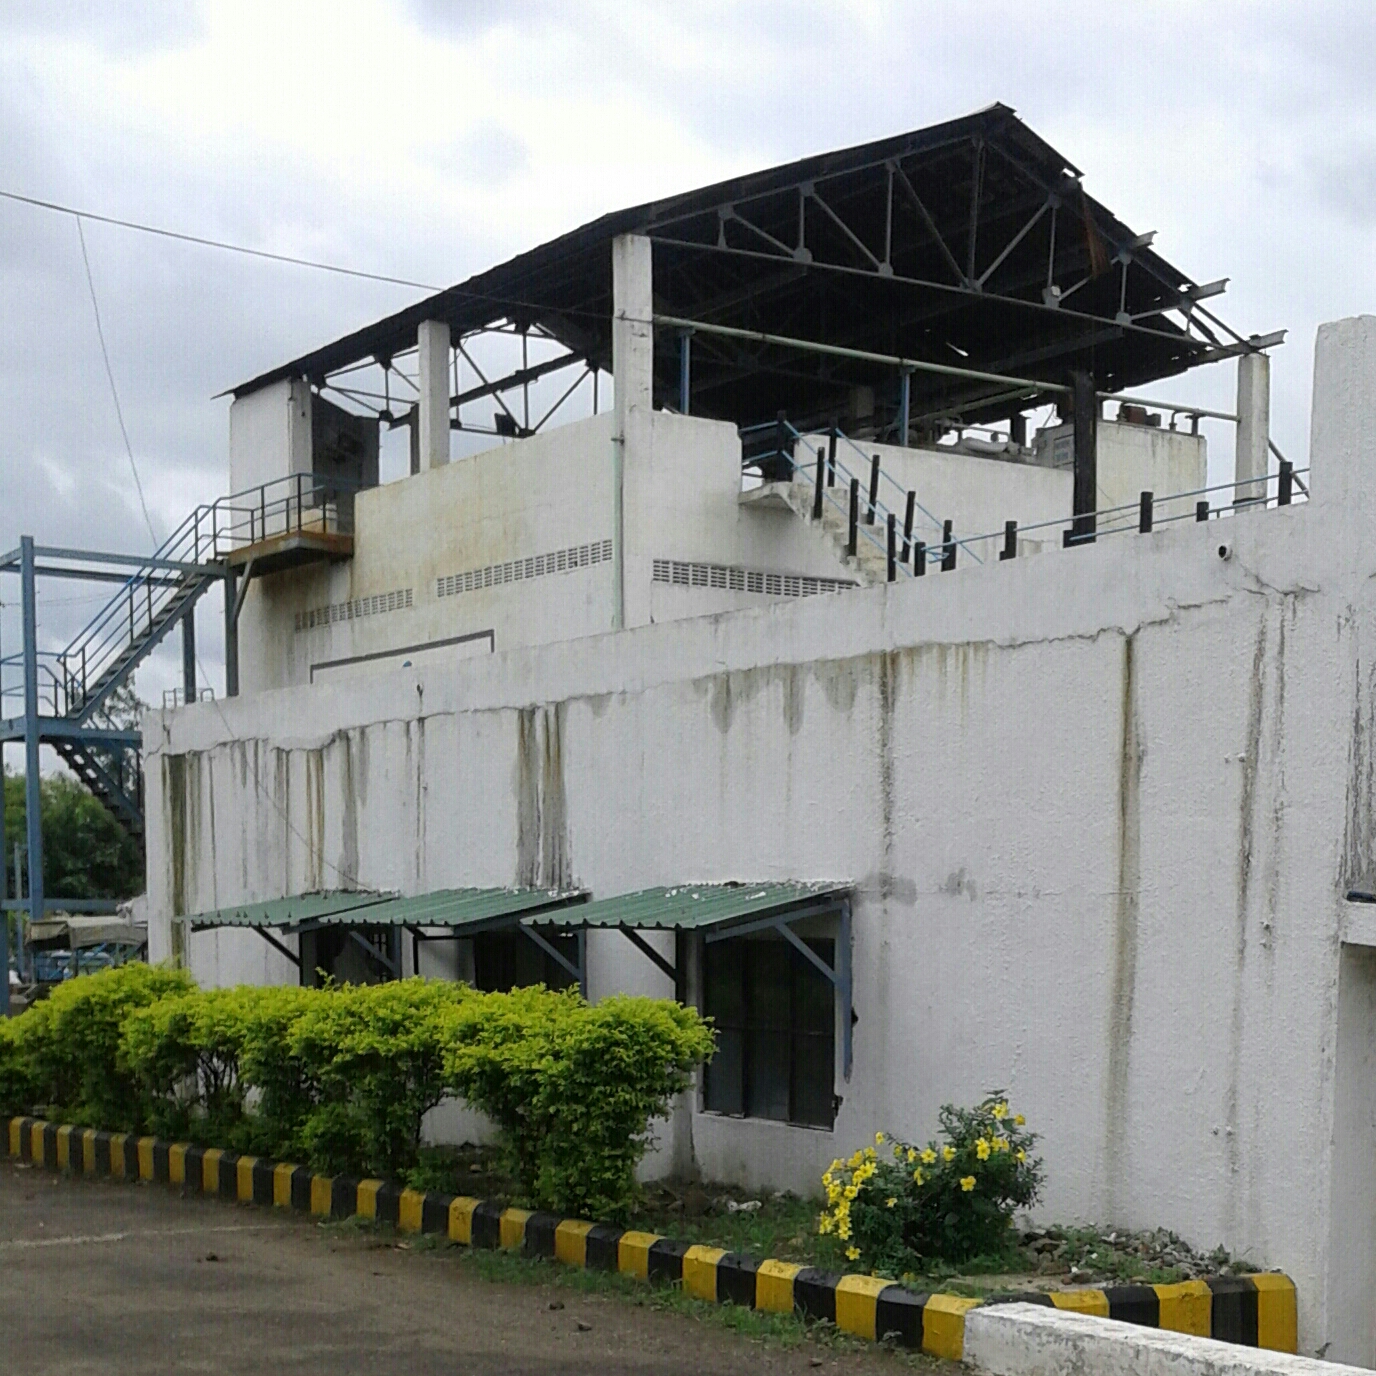
Common Effluent Treatment Plants serve industrial clusters. Of 41 assessed in 2025, 40 were operational, treating 286.31 MLD against 514.53 MLD capacity, but only 27 met the prescribed norms, so clusters remain a weak link.
Why it matters
Compliance figures come from a government programme and should be read as such, but the method (third-party inspection, geo-tagged evidence, sector-specific water-recycling targets) is what makes the trend credible. The remaining 14% non-compliant units, and underperforming shared plants, are where the next gains lie.
For more on the river itself, read how the Ganga is getting cleaner and how constructed wetlands help rivers. Explore more on water pollution and follow India sustainability news on Prakati.
Source: Press Information Bureau, Government of India (Ministry of Jal Shakti, 13 October 2026). Images: Ganges at sunset by Indrajit Das (CC BY-SA 4.0) and effluent treatment plant at MIDC by bk kartik21 (public domain), via Wikimedia Commons.